AI-generated summaries may be inaccurate and do not constitute medical advice. Third-party AI tools are not under Felix's control, and your use of them is at your own risk.
Key Takeaways
Recap: How does Felix calculate biological age?
Felix uses Levine’s Phenotypic Age, one of the most widely adopted biological age methods in north America. Felix uses Levine’s Phenotypic Age because it:
Is based on a large North American dataset (NHANES III)
Uses biomarkers that are commonly available through standard blood testing
Has strong scientific validity and interpretability
Creates a simple “summary score” that can be tracked over time
This makes it especially useful for patients doing repeat testing, lifestyle interventions, or preventative health planning. For more details, you can find the complete original publication here.
What are Contributing Biomarkers for Biological Age?
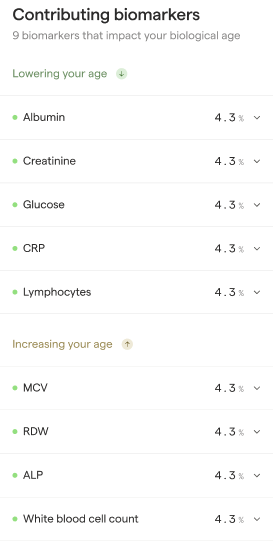
Felix reports contributing biomarkers to help patients understand what is driving their biological age result. Biological age is calculated from multiple biomarkers at once. Even if two patients have the same biological age, they may have gotten there for different reasons.
The “contributing biomarkers” feature answers:
Which biomarkers are pushing biological age up (older)
Which biomarkers are pulling biological age down (younger)
This helps make the result actionable — rather than just a single number.
How are contributing biomarkers calculated?
Felix uses the original NHANES III dataset that the Phenotypic Age model was derived from to understand typical biomarker distributions across age and health outcomes.
For each biomarker in the Phenotypic Age model:
Find the median expected value. Using the original NHANES III dataset, we identify the median (typical) value for each biomarker in the reference population. This median value acts as the “expected” benchmark we compare the patient against. Median values are specified by sex and 5-year age bucket.
Calculate the difference between the patient’s value and the median expected value. We compute how far the patient’s biomarker value is from the median benchmark. If the patient’s value is above the expected median, the difference is positive. If the patient’s value is below the expected median, the difference is negative.
Multiply the difference by the biomarker’s weight. Each biomarker has a different impact in the Phenotypic Age model. Felix applies the biomarker’s model weight (coefficient), which reflects how strongly that biomarker is associated with aging-related outcomes in NHANES III. This ensures biomarkers that matter more to the model have appropriately larger contributions.
Understand the impact. The direction (increasing vs decreasing biological age) comes from the sign of the final weighted contribution:
If the final weighted contribution is positive, that biomarker is contributing to a higher Phenotypic Age score, and is flagged as increasing biological age.
If the final weighted contribution is negative, that biomarker is contributing to a lower Phenotypic Age score, and is flagged as decreasing biological age.
Contributing biomarkers are not based on whether a value is “normal” or “abnormal” in a lab range. Rather, they’re based on whether that value pushes the Phenotypic Age model older or younger relative to the population.
Why might a patient have a normal or optimal value for a biomarker, but still have that biomarker be increasing their biological age?
This is common, and reflects the fact that biological age is model-based, not range-based.
Lab “normal” ranges are designed to catch clear problems (like disease or deficiency), but they don’t always reflect what’s best for long-term health or longevity.
Phenotypic Age looks at where your result falls compared to a large population (NHANES III), not just whether it crosses a cutoff.
A biomarker can be in the normal range, but still be slightly higher (or lower) than what’s typical for people with the best aging outcomes.
Biological age is also influenced by patterns across multiple biomarkers — so a value that looks fine alone may contribute differently when combined with the rest of your results.
Why might a patient have an abnormal biomarker that is decreasing a patient’s biological age?
This can happen too, because lab ranges and biological age are measuring different things.
Lab reference ranges are clinical guardrails, while biological age is a statistical model output.
The Phenotypic Age model uses weights based on population-level patterns, so some “abnormal” values may still move the model slightly younger depending on the direction and magnitude of the result.
Some biomarkers behave non-linearly — meaning the relationship isn’t always “higher is worse” or “lower is worse.”
Felix’s optimal ranges are designed for clinical prevention and interpretation, while contributing biomarkers are based on the NHANES III relationships used in Levine’s model. These won’t always align perfectly.
This does not mean abnormal results should be ignored — it just means biological age isn’t meant to replace medical interpretation.
Always defer to a healthcare practitioner’s opinion over biological age.
Biological age is meant to be a helpful summary, but it’s inherently incomplete and less specific than clinical interpretation.
Because it’s based on large population studies (NHANES III), it may not account for:
A patient’s full medical history
Medications or temporary illness
Biological age is best used as:
A directional signal
A progress tracking tool over time
A way to prioritize lifestyle changes
…but it should not be treated as a diagnosis or medical advice.
Disclaimer: This blog contains links to external websites that are not provided or maintained by, or in any way affiliated with Felix. Your use of any links is at your own risk.